Trying out the new Google Search Console URL Inspection Tool Update

Google started 2019 with a new algorithm update that impacted a wide variety of websites and caused fluctuations in search rankings. This update was only the beginning of Google’s 2019, as another update has been rolled out in one of their most popular search tools.
The Google Search Console is one of the most effective website tracking tools around, allowing users the ability to monitor multiple websites, track web pages that need attention, and assess website impressions and performance. The best part about this tool is that it’s free to use, which makes the job of tracking websites much easier. The latest update that has been launched is for the tool’s URL inspection tool, which has now been expanded to include more detailed information about the websites that you are tracking. Here’s a look at the new update, and how to access it.
URL Inspection

To take a look at the new features, all you have to do is to click on the URL Inspection Tool and enter the URL of the webpage that you want to take a look at.

After waiting for the URL to load, you can now click on the View Crawled Page button to see the data. If you are doing a Live Test of the Webpage, you can do the same thing by clicking on the View Tested Page.
You can view three sections after clicking on this, namely the HTML, A screenshot of the web page, and a third section that allows you to view HTTP Response, Page resources, and JavaScript console messages.
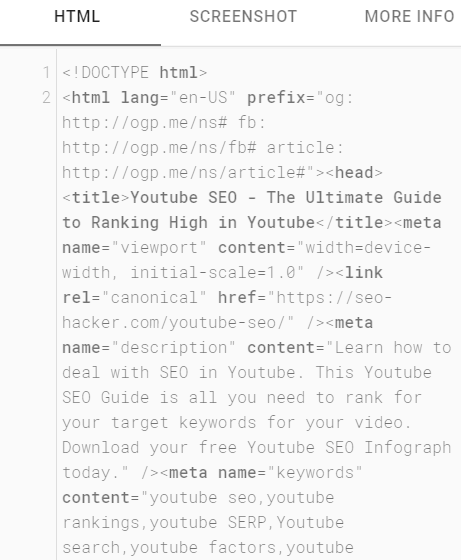
The HTML section is pretty straightforward, allowing you to view the web page code, which can help you track various page elements like H1 tags and tracking codes.

Next is the screenshot, which shows you how the web page looked like when it was crawled by Google. This comes in handy as any problems with the page, such as images not loading and unresponsive media can be instantly seen.
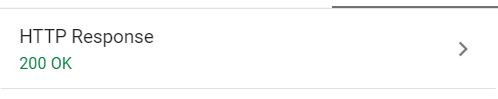
The third section contains three other details. With the first being the HTTP Response, which shows you if the website is responding and loading accordingly.
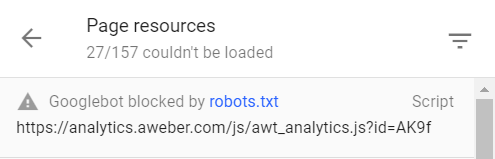
The next section is Page Resources, which shows you which resources are loading and not. This is important when checking any issues within the page, which can affect the user experience.
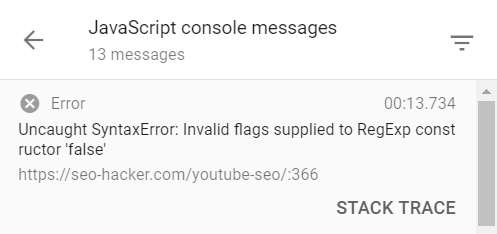
Lastly, the final section is JavaScript Console Messages, which shows you a list of messages that can be stacked traced to look for any issues.
Overall, these features make Google Search Console an even more effective tool, as this additional information allows users to be able to have a better assessment of their websites, which will allow better performance that would optimize the user experience.
Key Takeaway
The Google Search Console is one of the best SEO tools around, and this new update makes things much better by adding useful new features that will benefit every user.
If you have questions and inquiries about Google Search Console or SEO in general, leave a comment below and let’s talk.