A Look into the Google PageSpeed Insights Tool Update

Page loading speed has become a very important ranking metric. Each second becomes more crucial, as data shows that every additional second means a lesser chance of someone taking a look at what your website has to offer.
This is why tools like Google PageSpeed Insights offers you a look into how fast your website loads, and the best ways that could help improve its speed for better user experience. A few months ago, the tool was pretty simple and straightforward, with not as much data presented, which meant that you would have to access a separate website audit tool to get more information.
However, that is now a thing of the past, as the new PageSpeed Insights update now improves the functionality of the tool, with more data presented, along with Google Lighthouse integration. This new update has been rolled out during the past week, and it is worth taking a look to see how much it has improved.
Field Data
While the process of assessing page loading speed has not changed, the amount of data that would be presented after is now more detailed.
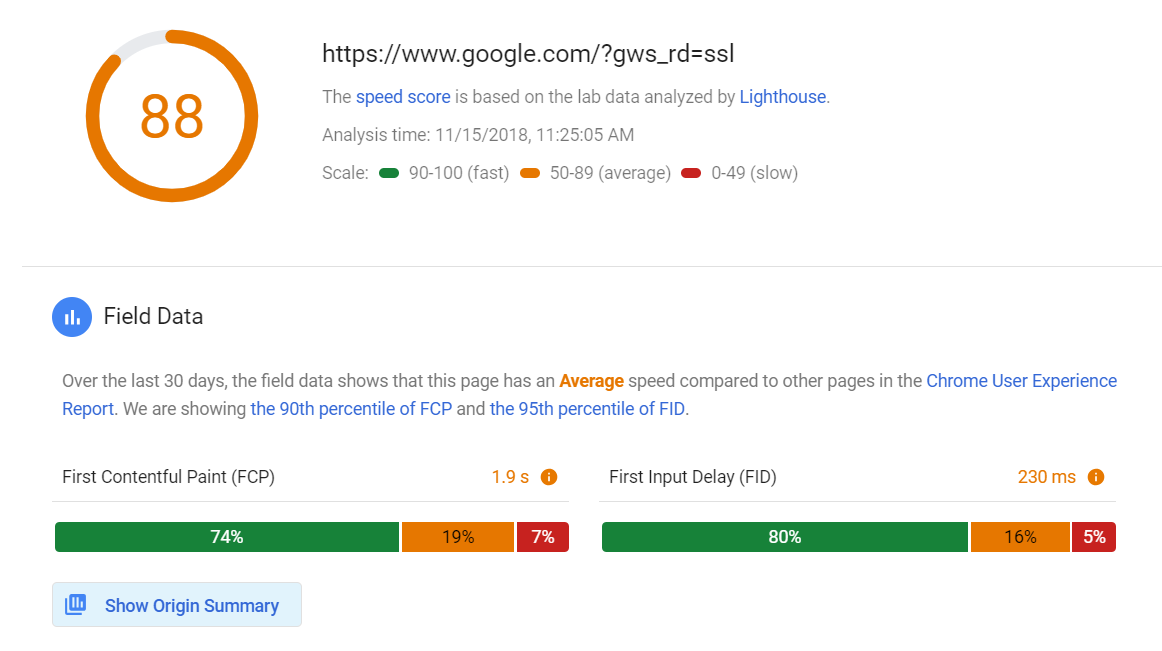
The first set of data presented is Field Data, which shows the average loading speed of a web page over the past 30 days. This data takes into account the findings that have appeared in the Chrome User Experience Report. You can view the number of pages that have experienced various loading speeds, giving you a better idea of how your page loads on different kinds of internet speeds.
Lab Data
Lab Data is data pulled from Google Lighthouse analysis. This data shows the amount of time it takes for the web page to reach a certain stage. There are six stages being evaluated, all of which affects page performance and user experience.
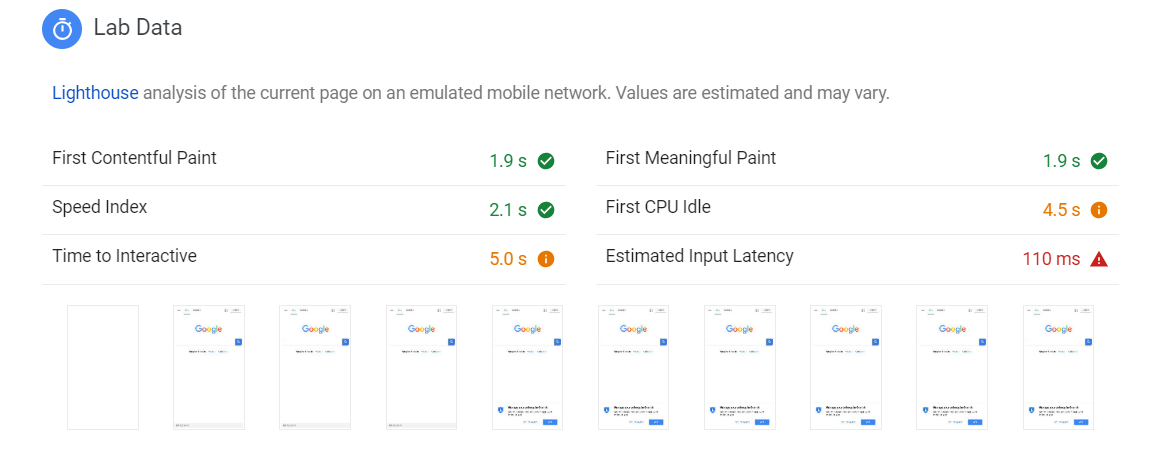
First Contentful Paint is the time in which the text or image appears, and First Meaningful Paint is when primary page content is visible. Speed Index is the amount of time that content is populating the page. Time to Interactive and First CPU Idle refers to the amount of time that the page now has clickable buttons and inputs. Lastly, Estimated Input Latency is the amount of time that the page is able to respond to user input.
Below this data, you get to see the process of how the page loads on a browser. This gives you a visual idea that will help you see each element of the page loading.
Diagnostics
The Diagnostics section is a set of assessments that evaluate web page performance. This is also where you can view your page audit, allowing you to see the best ways to optimize your loading speed. This section is quite similar to the page audit section that you can see in the Google Lighthouse Chrome extension, as it gives you solutions to your page performance issues.
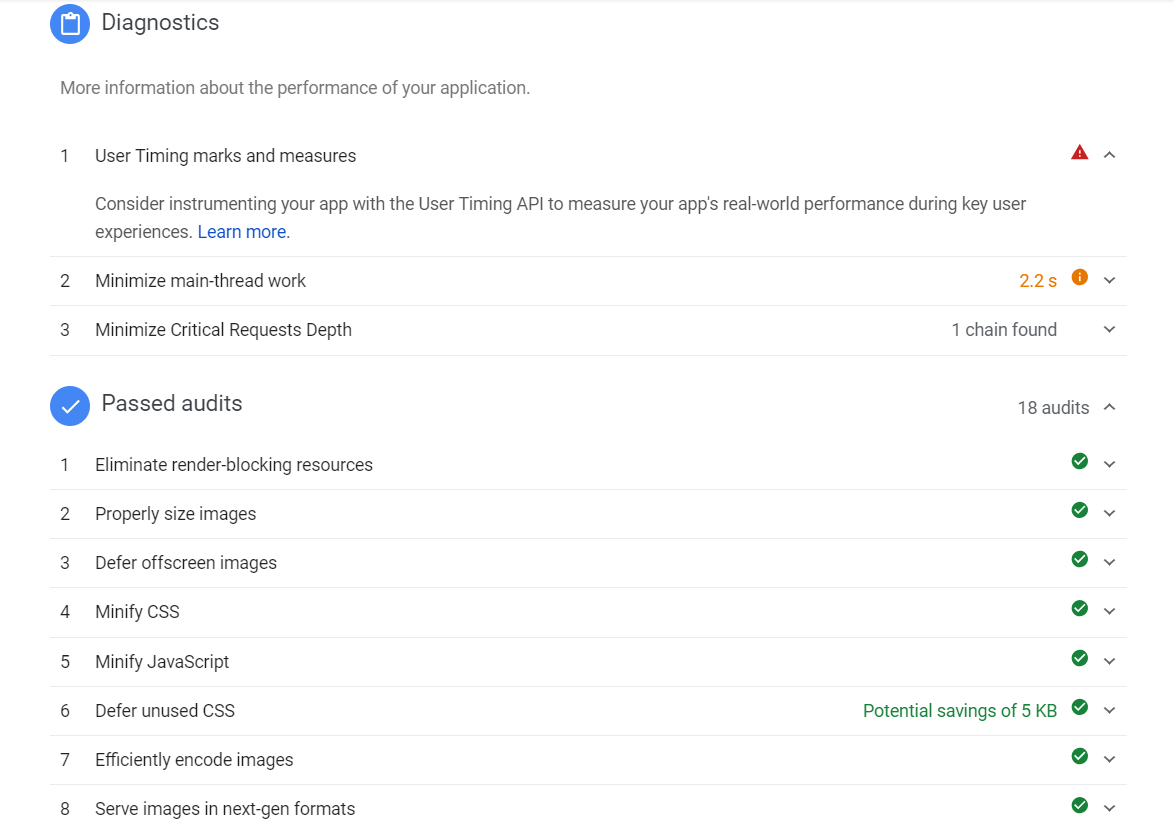
For example, I get to see the audits that passed, allowing me to see the things we did right to improve page loading performance.
All in all, the updated Google PageSpeed Insights tool offers much more information that makes it an even more effective tool. With Google Lighthouse integration, you are sure that the data you’re receiving would be accurate, allowing you to create strategies and techniques to improve your website.
Key Takeaway
The Google PageSpeed tool has been one of the more reliable page loading assessment tools around, and this new update gives it more depth, allowing you to look beyond loading speed, and delve into more data that explains the page loading process. With the Google Speed update affecting mobile page rankings, this new update surely helps to create pages that perform better.
If you have questions about mobile SEO or SEO in general, leave a comment below and let’s talk.